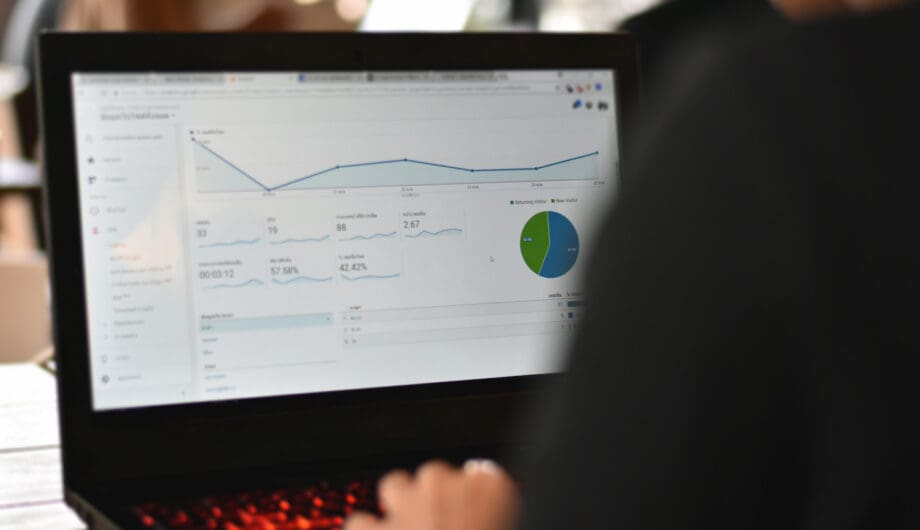
Longtime followers of this blog will know that I am a big fan of automation and a big fan of data, so you’d think that a automated data reporting would be something I’d be a big fan of. And I am… kind of. I do get automated reports on analytics and keyword ranking etc. And there is a lot of value in these.
However, they shouldn’t replace human eyes when it comes to reviewing and parsing the data because there are many factors that can lead you to misinterpret what you are seeing. Let me start with a real world example.
At the beginning of the month, I prepare reports for some of my SEO clients about how their sites are performing. I have automated reports set up on all of these sites, and that’s where I start. I opened up one report and immediately saw that traffic to the site was down over 50% this quarter.

TRAFFIC DOWN 50%! OMG, WHAT HAPPENED?
This was not a mistake. This is what the data showed, and it was accurate. But as with anything, that wasn’t the whole story. And that’s why human eyes are important when reviewing these things.
In this case, yes, numbers showed that traffic was down over 50% this quarter from the previous quarter. However, what it didn’t show was that the previous quarter a post on the site had gone viral, leading to a three-day traffic spike that threw off all the numbers.
Yes, there was less traffic than the previous three months… but only because the previous quarter had a giant surge.
But if I sent a report to you and said, “Traffic is down 50%” with no explanation, that would be upsetting and concerning. (I feel like politicians do things like this a lot.)
Another example, when looking at the data for a different website, I saw that impressions (which are when your site shows up in the search results, not when someone visits your site) were way down from the previous month, but the click through rate (CTR) was way up.
Upon looking at those numbers, one might think, “OMG, fewer people are seeing my site in the searches!” Which is, again, technically true. Fewer people did see the site in their searches. BUT… the CTR went up 25%. Which means a significantly higher number of people actually clicked on the website in the search results and landed on the site.
This is why it’s important to have a human look at this data to figure out what was going on. If the impressions going down was problematic, then more people wouldn’t have gone to the site. What happened in this case? The website had been showing up in a popular search result that was, what I would classify, as a mistake. It was showing up in a search result for a keyword that it shouldn’t have been, resulting in more impressions but no clicks. Once it dropped from that search, the impressions went down, even though clicks went up.
And because the clicks went up, I went to see what was driving that. The site had dropped in the results for one particular search phrase but had risen for another keyword. And the first keyword it had dropped in the results for was a keyword that wasn’t useful or relevant. People using it weren’t looking for what this website offered, which is why it wasn’t getting clicks. But the other keyword was. And this is why MORE traffic isn’t always better.
Let me add one more example. A client came to me a while back concerned because their site was getting less traffic. And I took a look at the data, and it was true, traffic overall was down. But when I started to parse that data, organic search traffic was actually up. Quite a bit, actually. But referral traffic was down. (Referral traffic is traffic your site may get from being linked on another website or through social media.)
And upon further investigation, it was actually the analytic data was being skewed by referrer spam. The TL;DR version is just a ping to your site from a fake URL, which shows up in analytics etc. so you see it and go… huh, what’s that website? And then you click that link.
Anyway, the referrer spam had been reduced, so that traffic appeared to be down, even though it was actually up if you removed the spam visits.
Context is everything
That’s not to say that these automated reports are without value. They are a great place to start to see trends and find patterns and understand how your site is performing. And when I do any evaluation, that’s the first thing I look at to see the initial data. But as with any important argument, you can’t view it without context or you may not get the real story.
(I feel like this is a metaphor for life.)
Don’t panic if you see something like this come up in your reports. Automated data reporting is great, but you need to look deeper and really learn why you are seeing the data you are. If you don’t understand the data and what’s driving it, then you can’t effectively use data to create meaningful changes to your website that drives more traffic and more conversions.
Amy Masson
Amy is the co-owner, developer, and website strategist for Sumy Designs. She's been making websites with WordPress since 2006 and is passionate about making sure websites are as functional as they are beautiful.
