You’ve put in the time and effort to optimize your website, but how do you gauge the effectiveness of your SEO efforts? How can you tell if your website is climbing the search engine rankings and attracting the right audience?
Doing the optimizations is just step one. Now you have to understand if it’s working. You need to learn how to measure SEO success. This post will explore the data points that matter most, along with practical guidance on interpreting the information and making data-driven decisions to optimize your website.
Understanding SEO Success: It’s More Than Just Rankings
It’s tempting to equate SEO success solely with high keyword rankings. While rankings are undoubtedly important, they paint an incomplete picture. A truly comprehensive SEO strategy encompasses various aspects, each contributing to your website’s overall performance. Here’s a breakdown of the key areas to consider:
Organic Traffic:
This metric measures the number of visitors who arrive at your website through search engines, excluding paid advertising. An increase in organic traffic over time suggests that your SEO efforts are paying off, making your website more discoverable to your target audience.
How to get this data in Google Analytics
- Log in to your GA4 account.
- Navigate to “Reports” in the left sidebar. This will take you to the “Reports snapshot” dashboard.
- Go to the “Life cycle” section and then click on “Acquisition” > “Traffic Acquisition.”
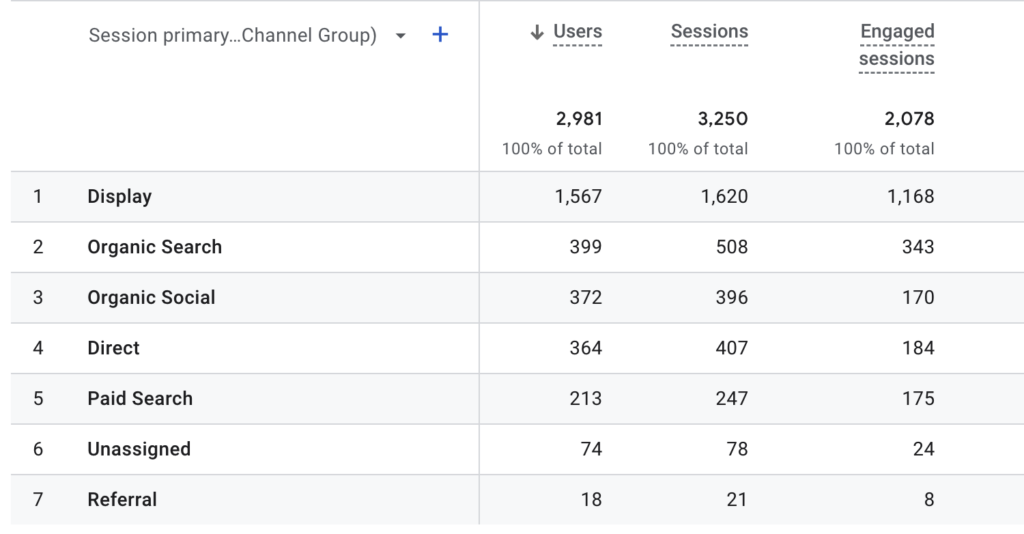
- The “Traffic Acquisition” report contains data on all your website traffic sources, including organic search. You’ll see a breakdown by channel.

When you look at this, you can tell that 399 visitors to this site during a specified time period came via organic searches.
You can also show a comparison in Google Analytics, to compare certain periods of time against previous periods of time. This is a very helpful set of data as well.
How to compare data
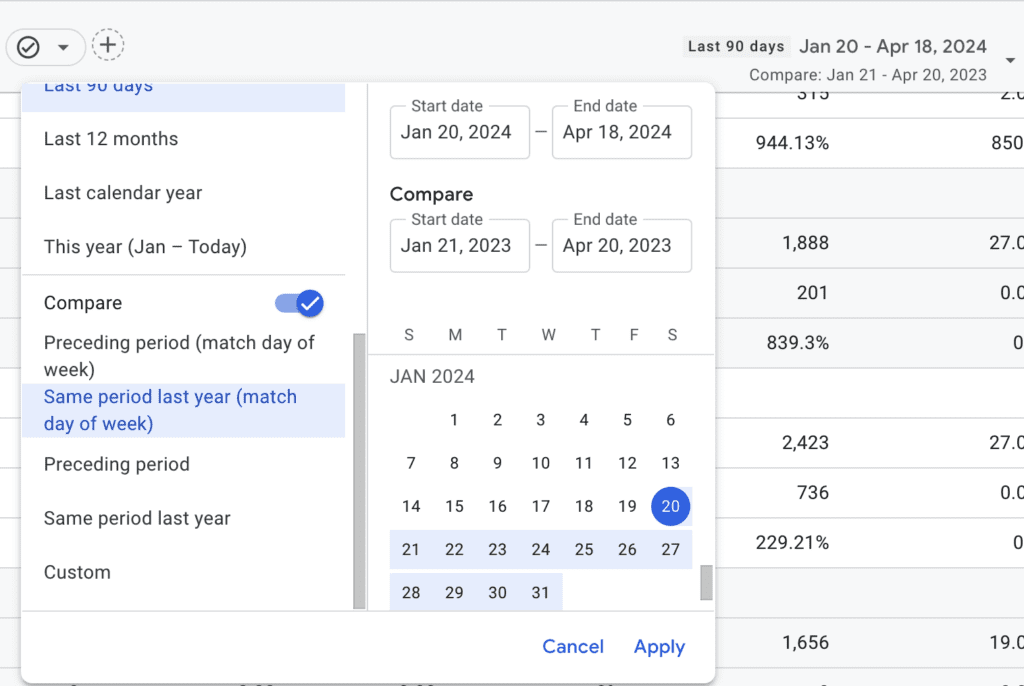
Click on the date range selector in the top right of your analytics, scroll down and toggle on the Compare option.

You have options for comparing the current data to the preceding period (so if you are looking at 90 days of stats, comparing to the 90 days right before) or the same period last year. I like to do both, because month to month and quarter to quarter can fluctuate based on seasonality and will likely show slower improvements, while you can see a more broad change in the year to year comparison. Check these differences out.
Preceding Period

Preceding Year

Now isn’t that something? When you look at the comparison from this quarter to the quarter preceding it you see that the traffic has increased by 8%. And that is absolutely fantastic. I will take that any day. But look at the comparison since the same time last year? Um, what? That’s amazing. And that is a stat that is easy to overlook if you are only looking month to month or quarter to quarter. Make sure you are evaluating long term growth.
Keyword Rankings:
Tracking your ranking for relevant keywords is important for understanding how well your website performs for specific search terms. As your SEO improves, you should ideally see a gradual rise in rankings for targeted keywords. However, stop Googling yourself and using that to see where you are. That will give you false information. Google personalizes search results to some extent based on your location, search history, and other factors. So, the position you see might be different from what others see. Even in incognito or private mode, Google might still consider your browsing history.
If you want to evaluate your keyword rankings, you need to use a rank checking tool that monitors your keyword changes over time. I use Moz and Mangools for this.
Tracking keyword rank over time offers several benefits for your SEO strategy:
- Measure SEO effectiveness: It acts as a benchmark to see how well your SEO efforts are working. By tracking rankings alongside other SEO metrics, you can identify what’s working and what areas need improvement.
- Identify trends: Tracking rankings over time lets you see trends. Are your rankings steadily climbing for targeted keywords? Or have they dropped significantly? This data helps you understand the impact of SEO changes and algorithm updates.
- Monitor competitors: You can track your competitors’ rankings for the same keywords you target. This reveals their SEO strategies and allows you to identify opportunities to outrank them.
- Adapt to changes: Search trends and user intent are constantly evolving. Tracking rankings helps you discover new keywords with rising search volume and adapt your content strategy accordingly.
It’s important to know how your rankings are trending over time.
User Engagement:
User engagement metrics like bounce rate (percentage of visitors who leave after viewing one page) and average session duration indicate how well your website resonates with visitors. Lower bounce rates and longer session durations suggest that users find your content engaging and informative.
When Google switched us all over from Universal Analytics (UA) to Google Analytics 4 (GA4) they promised they were doing away with the bounce rate tracking, but they’ve backed off on that after a lot of pushback. People need and want to know the bounce rate. However, it’s not something that comes standard in GA4 reports, you have to turn it on.
How to turn on bounce rate in GA4
- Go to the report you want to customize in GA4 (under the “Reports” section).
- Click “Customize report” in the top right corner.
- In the right panel, under “Report data” click on “Metrics”.
- In the search bar, type “bounce rate” and select the “Bounce rate” metric.
- Click “Apply” to add bounce rate to your report.
Instructions from Google available here

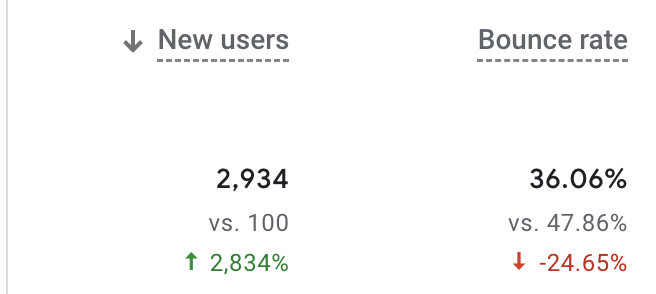
You can see when I turn on the bounce rate metric, that the bounce rate for this site over the last quarter has gone down by 24.65%. We like to see a low bounce rate, that means people are sticking around.
A note about bounce rates…
If you notice you have a super low bounce rate, like something below 10%, you should probably login and make sure that you have your analytics script installed correctly. A bounce rate that low is VERY unusual, and I’ve seen plenty of people brag about how low their bounce rate is only to have it pointed out that their analytics script was accidentally installed twice. An average bounce rate for most websites is between 26% and 70% and this will vary by industry and website goals. (For example, websites that are primarily a blog will have a higher bounce rate because people will click through on one blog post, read, and leave.) Anything below 40% is considered a very good bounce rate.
Conversions:
Ultimately, the goal of SEO is to drive conversions, whether it’s making a purchase, subscribing to a newsletter, or downloading an ebook. Analyzing conversion rates helps you assess how effectively your website translates organic traffic into desired actions. But Google Analytics will not start tracking conversions automatically, you have to set it up.
Here are the step-by-step instructions for tracking conversions in GA4:
1. Set up your conversion events:
- Go to the Admin section on the left sidebar of your GA4 interface.
- Click on Events.
- Click on Create event.
- Choose Create to define a new event.
There are two main options for configuring your event:
- Use a recommended event: GA4 offers pre-built events for common actions like purchases or sign-ups. You can find these under “Recommended events”.
- Create a custom event: If your desired conversion doesn’t fit into a recommended event, you can create a custom event with a specific name.
- Set matching conditions: Here you define what triggers the event. This could be a page view of a specific URL (e.g., your thank you page) or a user interaction like a button click.
- Add parameters (optional): Parameters provide additional context about your conversion event. These can be helpful for further analysis. For recommended events, some parameters might be pre-defined (e.g., value for a purchase).
- Click Save
2. Mark your event as a conversion:
- Go to Admin > Conversions.
- Click on New conversion event.
- From the list, select the event you just created as a conversion.
- Click Save.
3. View your conversion reports:
- Go to Reports > Life cycle > Engagement > Conversions.
- This report provides an overview of your conversion events. You can see the number of conversions for each event over a chosen time frame.
Getting ranked high is great. Getting more traffic to your site is amazing. But getting conversions? That’s the coup de grâce. That’s how you know your website is working for you.
Amy Masson
Amy is the co-owner, developer, and website strategist for Sumy Designs. She's been making websites with WordPress since 2006 and is passionate about making sure websites are as functional as they are beautiful.
