

If you are using Google Analytics, you may have already realized this much… it’s complicated. There’s a LOT of data in there about Google Analytics traffic. On a monthly basis, I get emails asking me questions about what this number means and what that number means and how to make sense of it all.
The truth is, I doubt anyone fully comprehends everything that Google Analytics has to offer. Most people pop on over to the Dashboard, look at the stats there, are happy if they have traffic, and then move on.
But that traffic can mean a lot of different things, but as a business owner, you can’t know it all. I mean, you probably can, but you have to run your business, and most of us don’t have time to become Google Analytics experts. So what should you really care about?
If you are working on your SEO, then you should pay attention to your Organic Search traffic. If you go to Audience->Overview, you get an overall view of all the traffic coming to your site, but this can be misleading. This includes spam traffic (and yes, there is analytics spam), bot traffic, and sometimes your own views of your site if you haven’t excluded yourself. This is a false sense of security.
Organic Traffic
If you want to see your organic traffic for your website, you have to go to Acquisition->All Traffic. Then navigate to Channels and finally select “Organic Search.” This view will show you only the traffic you have coming to your site through the search engines. That means not your mom landing on your site (unless she searched for it first), not people who clicked on social media links, and not people who clicked on ads. Just those who got there via search.
Why is this important?
It’s really easy to look at the overall data and see an upward trend and think “Hey, I’m doing great” and not realize that your organic traffic is not changing and all your traffic is coming from bots or spam referrals.
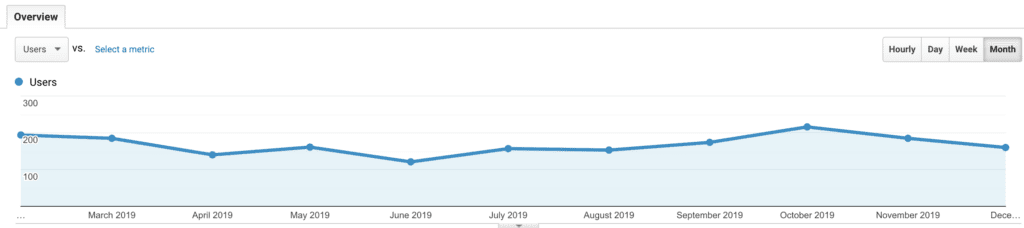
I was working with a client on SEO, and had optimized the site, was actively working on finding backlink opportunities, and after several months, was frustrated that traffic to the site was still going down instead of up, even as the site’s keyword rankings were on the rise. What was going on?
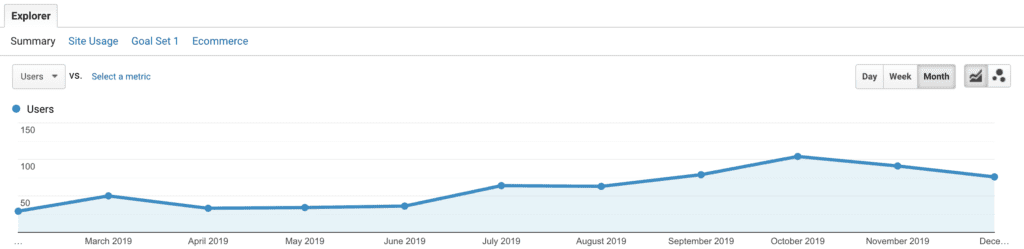
I was looking at overall traffic, and not organic traffic. What happened? Prior to our SEO, there was a spam referrer sending a ton of traffic to the site, and that stopped right around the time we started the SEO. So overall traffic went down A LOT because the spam traffic stopped. But once I filtered the view by Organic Search, I could see that organic search traffic, the traffic we actually wanted, was going up.
But if you don’t know to look there, you may actually be misinterpreting the results you see!
Don’t let the bounce rate deceive you
Your website’s bounce rate is the percentage of users who land on one page and leave without seeing another page. And it’s a pretty important metric of how your site is doing. However, this is the kind of thing that has to be interpreted carefully, much like the previous example. Just looking at your site’s overall bounce rate can be really deceiving, especially if you have a blog.
Why? Because blog posts draw traffic for people looking for specific information. And once the person reads your blog post, they are much more likely to navigate away from the site because they found what they needed on that post. Blog posts will naturally have a much higher bounce rate than other pages of your site.
What you really need to pay attention to is the bounce rate on your homepage and other landing pages to know if those pages are keeping your users’ attention.
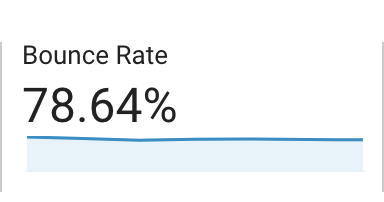
When I look at my own analytics for the last week, I see I had an overall bounce rate of 78.64%. But that includes data from every source.
But when I narrow down the analytics to show data for just my homepage, guess what my bounce rate changes to? 48.71%! That is a HUGE difference and much more indicative of what my real customers are doing on my website.
How to look at your bounce rate per page
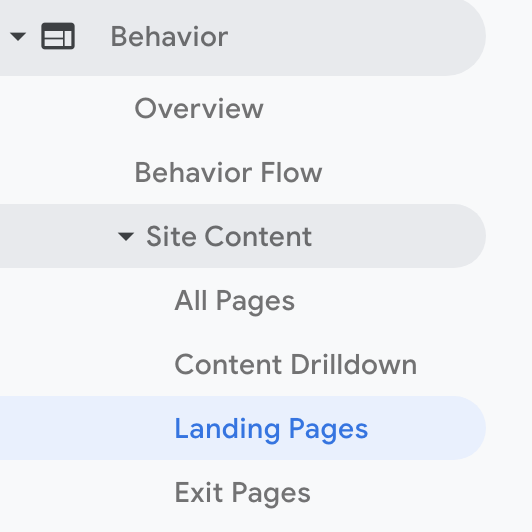
In Analytics, go to Behavior->Site Content->Landing Pages and then click on any page you want to view stats for. There’s a lot you can learn from seeing what people do on any particular page.
When I do that, I can also see that my most viewed blog post has a bounce rate of 93.43%, which is an example of readers finding the information they need and leaving the site.
It’s important to know exactly where you need to go in order to find data that reveals the truth about your users. Don’t make the mistake of only looking at the overall data and making decisions based on that information. There’s a lot of nuance to the data that needs to be interpreted.

Amy Masson
Amy is the co-owner, developer, and website strategist for Sumy Designs. She's been making websites with WordPress since 2006 and is passionate about making sure websites are as functional as they are beautiful.