

Thanks for coming back to read part 2. There’s a lot of data to understand in search console. And let’s be honest here, I probably don’t understand all of it. I left off talking about the data under the Performance area, and I want to keep talking about that, because I think that’s the information most people will find the most useful. So if you are logged into your search console account, go ahead and head over to Performance and follow along.
Queries
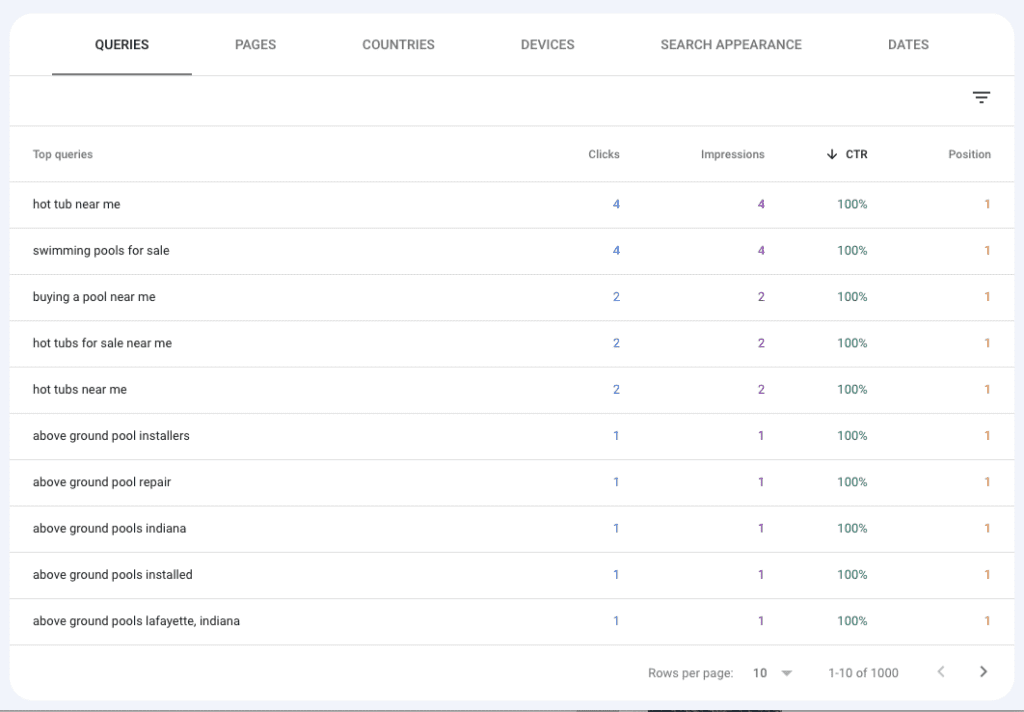
The first option under performance you see is Queries. As a reminder, queries are the search terms that result in your site being served up in a search result. See an example below from a pool company.
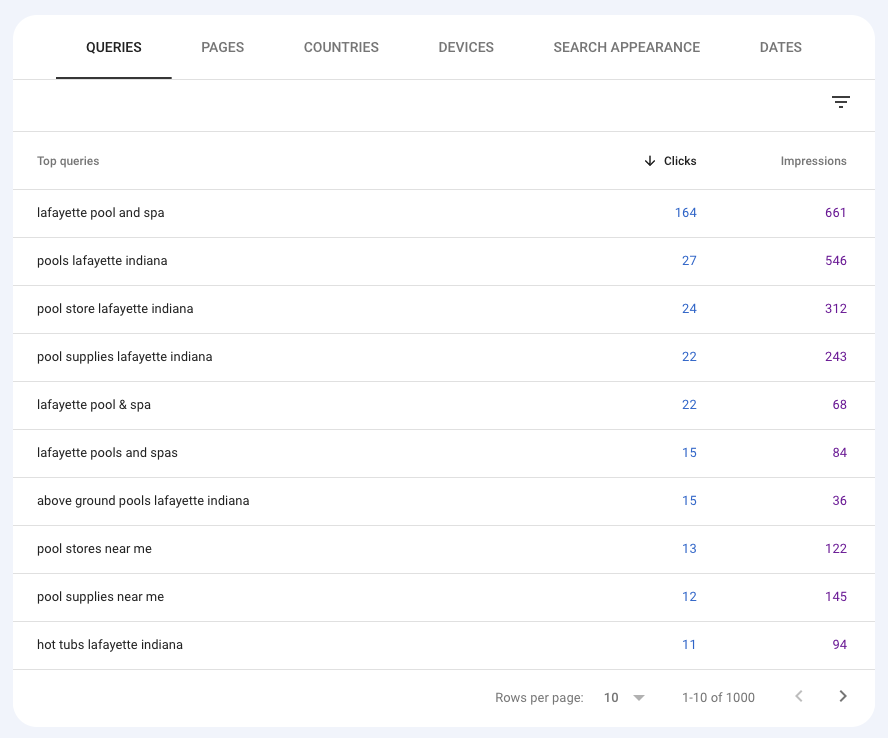
The default view gives you 10 rows and shows you the top 10 keywords that your site got the most clicks for. In the default view, you can see the clicks and the impressions. This is over a three month time, the default view, unless you change the time frame. You can change to more rows if you’d like, or you can change the order to show it by the keywords with the most impressions versus the most clicks.
A click is just when someone sees your site in the search results after a search and then clicks on it. In this example, the keyword that got the most clicks was lafayette pool and spa.
Pages
From here, we can click on the Pages tab to get information about what pages are being served up in the search results. Fun fact, it’s not always your homepage. And that’s a good thing. All the pages of your site can show up in the the search results and if you optimize those pages for different keywords, then you want different pages to be showing up. Usually you’ll see your homepage get the most clicks, but not always.
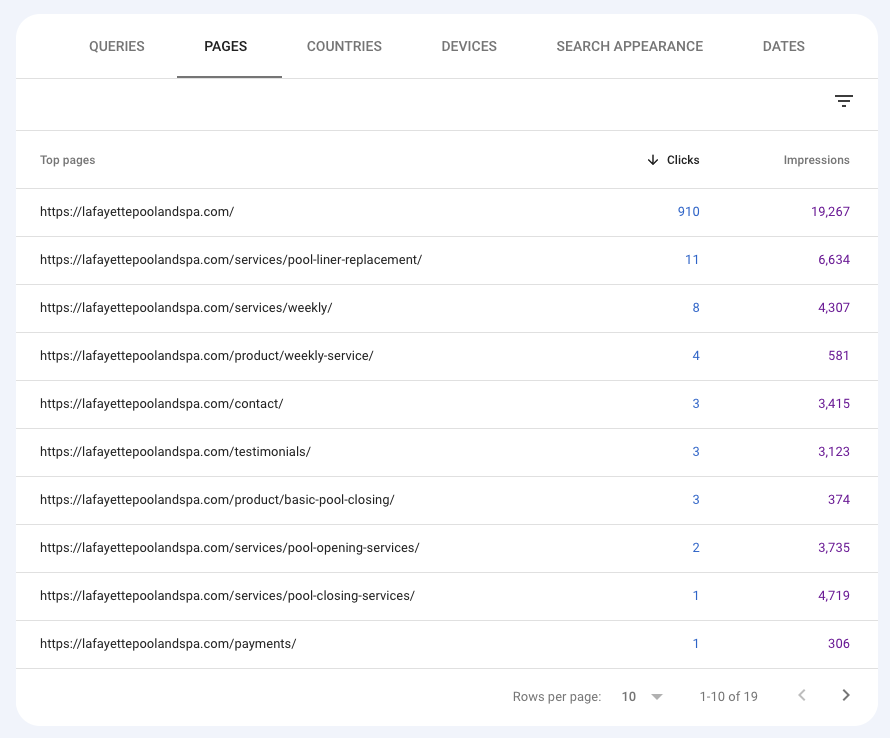
Here are the list of the top ten pages for this site that are getting clicks. You’ll see that in this case, their homepage gets the most clicks. Followed by their page on liner replacements.
Fun fact, for a long time the #1 page in the results for Sumy Designs was one of our blog posts. I wouldn’t say it was viral, but it was #1 for a lot of searches and it outpaced every other page on our site. (We have since removed the blog post because it was outdated, but it definitely generated the most traffic.)
Countries
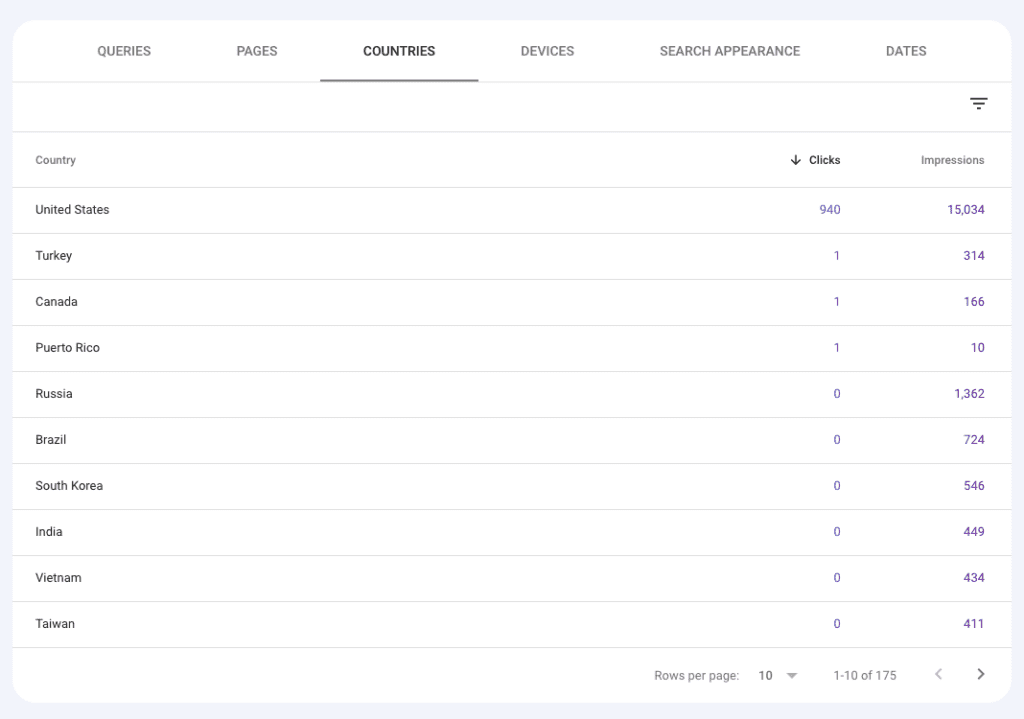
The next view is countries, and just shows you the countries where most of your clicks are coming from. If you are a smaller US business, you are most likely going to have primarily US clicks. In this example, you can see almost all the clicks to this site are from US visitors, but there are three from other countries, and a surprisingly high number of impressions for Russia (but no clicks).
Devices
The next view is devices, and this is a good one to take a look at so you know what devices people are using to search. Keep in mind this number is probably going to look different than the devices that show up in analytics because that shows people who visited your site, not people who searched for your site. In this example, you ca see that this website is far and away having more searches and more clicks on mobile. What this means is that their site really needs to kick ass in the mobile view.
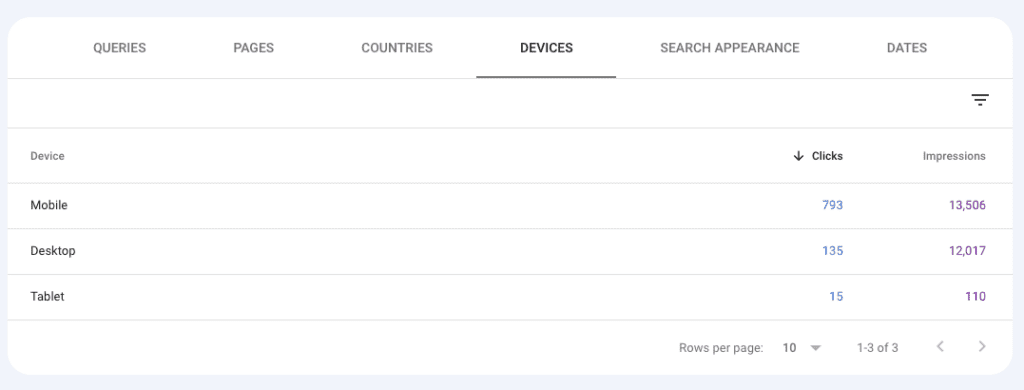
That’s not to say their desktop view shouldn’t be good. It definitely should. But the mobile version needs to rock because most of the searchers are using a phone.
Search Appearance
This view is mainly going to show you special features your site may have, like rich snippets and videos. A lot of new or more simple sites aren’t going to have much data here. Here’s an example from a site that has videos and FAQs.
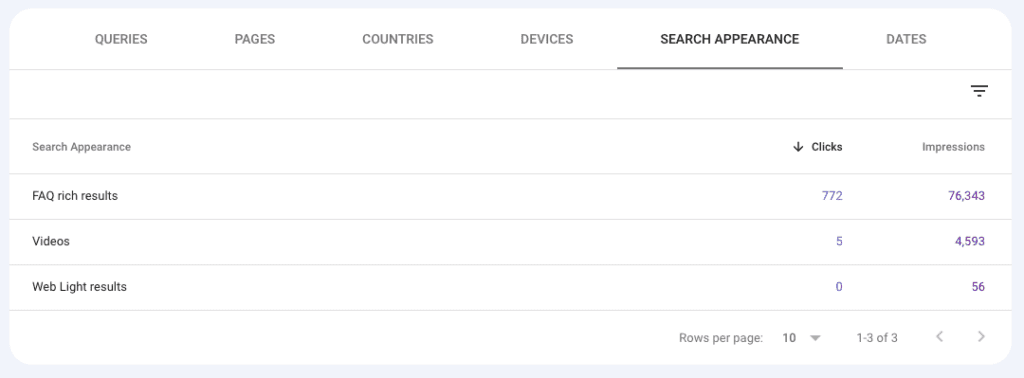
This site is actually getting a fair number of clicks on their FAQs.
Dates
Finally we have the dates column. This just breaks down your search data by individual date.
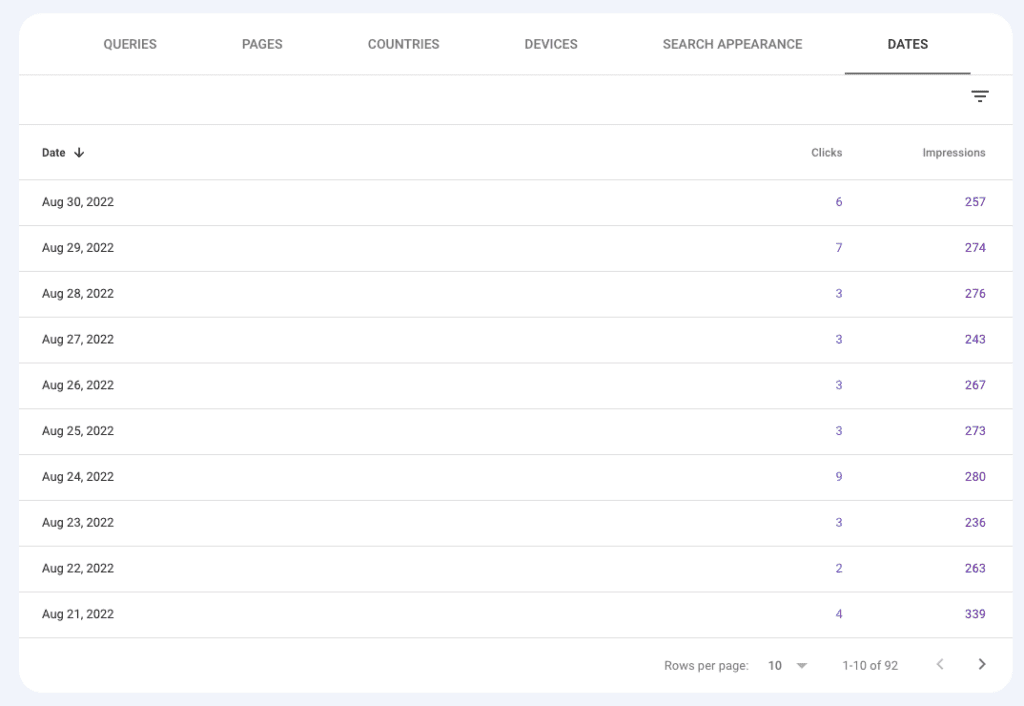
This can be really useful if you have a traffic surge to see what was behind it.
Different Views
Ok, so you know I’ve been talking about clicks and impressions, which are the default view when you login to search console. But you can actually also add in the average CTR and the average position. And this is really good information too, so let’s talk about it.
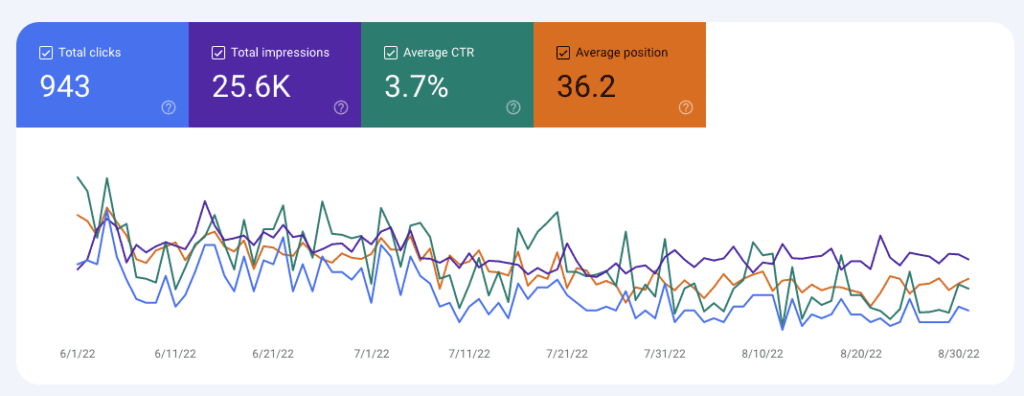
I’ve covered clicks and impressions, but let me explain the average CTR and Average position.
CTR: This is Click Through Rate, and that’s the percentage of folks who see your site in the results and then click through to visit the site.
Position: The average placement of your site for any given keyword phrase.
Now once I checked all those boxes, my graph got really messy. But take a look at the query data now.
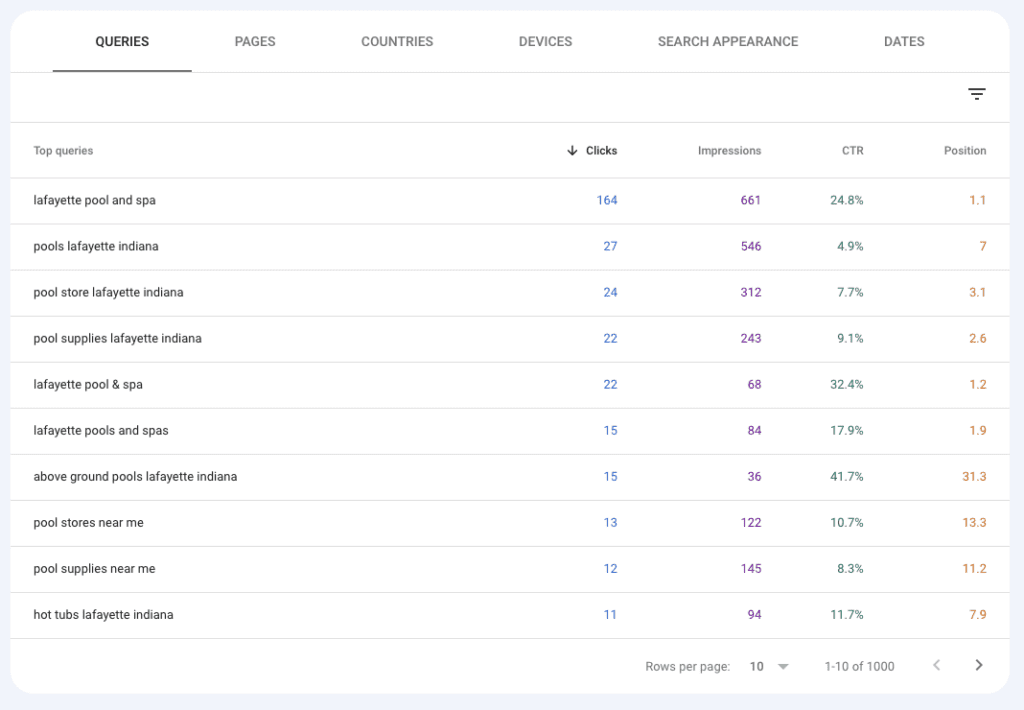
This is really interesting. You can see that obviously the click through rate is highest for the keyword that is the business name, and that this site ranks #1 for their business name. That’s pretty common and good. Unless you have the same business name as another business, that’s typically what you see in the top.
But look at the rest of those CTRs. For one of their searches, they have a 41.7% CTR. That is an amazing click through rate. CTRs vary by industry, and some industries will see higher or lower CTR but on average, we expect and would like to see a 2-5% CTR. That seems really low, right? But that’s the average.
You can also reorder this data by any of those four columns, so take a look here when I reorder it by CTR.
They have at least 10 CTRs of 100%. You might see this and think WOW but don’t get too excited. Most of those only had a handful of searches. So it’s great that they had 100% CTR on those key phrases, but that’s one search over a three month period, which is less impressive.
You’ve got all this data, now what do you do with it?
That’s a great question, and that’s the most important part of having and using Google search console. What do you do with this data? Knowing what people are searching for and where you show up for those searches is important. So often people spend time trying to rank for keywords that aren’t being used in searches. I had someone come to us for a new site once and in their inquiry they proudly showed me how they were #1 for several different keywords and they had worked hard for that. And when I did a Google search, they were #1 for those keywords. Unfortunately when I researched the keyword what I saw was that nobody was really searching for those keywords.
I wish I had access to the search console for that site (they ended up not hiring us) because there would be very little impressions for those keywords, and many of those would be the site owner running a search.
What I like to do with this data is start by seeing what keywords are getting the most impressions. The ones with the most impressions are the ones that are getting the most search traffic. And if you aren’t ranking high for those keywords, then those are the ones you to work on.
So for this site, I reordered the data by impression and here’s what you can see.
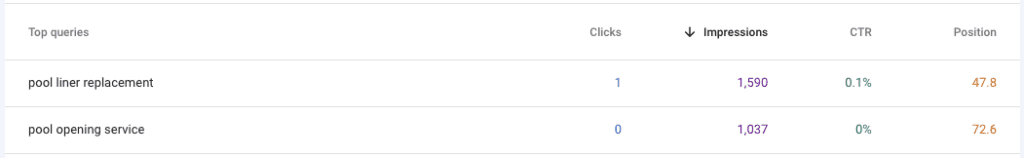
Ok, so this site is getting the most impressions for pool liner replacement and followed by pool opening service, but they aren’t on the first page for either of those search terms.
Caveat: Search console data isn’t showing you the data from the “map” views, which would be the results of business in your specific search area and it’s not showing you the ads, so this is the organic search results below all that other stuff. This particular business does rank #1 for these terms in the map view. But we’re talking about overall search results. Additionally, the position you see is the national average, and you might search and see your site higher or lower. These numbers fluctuate a lot AND Google tailors search results to individuals based on a lot of factors such as location, search history, etc. So your individual results may look different than what you see in search console.
But according to the search console data, we should really work on optimizing the pages for pool liner replacement and pool opening service to try to get a higher position. A higher position will typically usually result in a higher click through rate.
The next thing I would look at would be to see any keywords where you have a high impression count and a decent position, but a low click through rate. If people are seeing your site in the search results but not clicking through, then ask yourself why? What are they seeing when they search that makes them skip over my listing and not click on it? It could be that your meta title and meta description aren’t very compelling. Remember you can choose what people see for your site in the search results (see linked post for more information.)
Additionally, the more clicks your site gets, the higher your click through rate is, that affects your position as well. When Google sees a site getting a lot of clicks, then it realizes that the site in question seems to be a good, relevant answer for what searches want. If you are giving the searches what they want, then your site is going to naturally rise because Google wants to serve up good search results. More clicks means a higher position.
I fear that this may turn into a 10 part series, but there’s so much data in search console to learn. If you haven’t set up search console yet, do that today and start learning how your site is really performing in searches. You’ll be glad you did.

Amy Masson
Amy is the co-owner, developer, and website strategist for Sumy Designs. She's been making websites with WordPress since 2006 and is passionate about making sure websites are as functional as they are beautiful.